Average cost
Depending on what version of the app you’re using, you’ll see either the following average cost calculation or the previous average cost calculation when looking at stocks, ETFs, and options. Robinhood Crypto and Retirement use the previous calculation regardless of app version.
Average cost calculation
Robinhood defines average cost as the cost per share of your current open position. It is used to calculate the unrealized profit and loss of your current position. The tax cost basis is different. Wash sales executed before 2024 are included in the average cost.
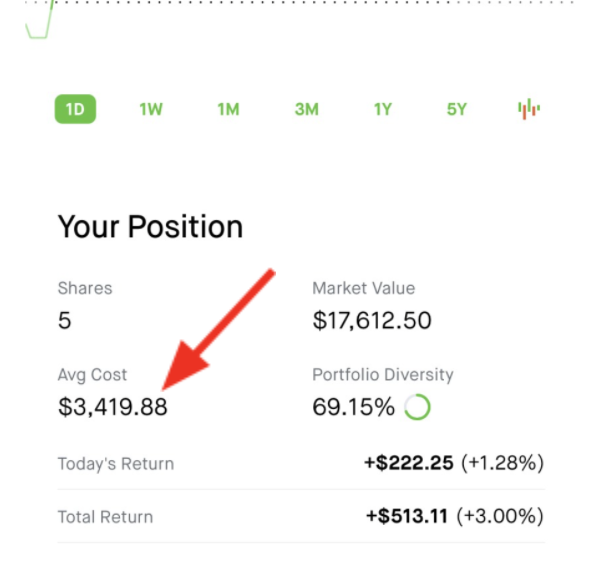
The average cost is also an input to the total return calculation:
Total return = (Market price - Average cost) * Total shares
$513.11 = ($3,522.50 - $3,419.88) * 5 (calculation may reflect sub-penny rounding)
The average cost is used as a reference point for estimating unrealized gains, and isn’t intended for determining your realized gain or loss for tax reporting purposes. If the average cost calculation changes, you’ll see a tooltip explaining the change. You can also read our disclosures at the bottom of the stock, ETF, or options detail pages to see how average cost is defined.
To get this updated average cost calculation for stocks, ETFs, and options positions, be sure you’re using the latest version of our app.
Tax cost basis is different
Average cost isn’t the same as the tax cost basis. The average cost or credit calculation may not always include the following:
Don't use these average cost calculations to determine your realized gains or losses for tax reporting purposes because they may not match your tax forms, if applicable.
The tax cost basis is the original cost of an asset or investment, adjusted for applicable trading fees, corporate action activity, or a wash sale, for tax purposes. The default method for your Robinhood account is first-in, first-out (FIFO), which is selling the shares you bought first. The shares themselves aren’t specifically tracked, but the cost associated with those shares is expensed first. Check out Cost basis for more details.
You can also review your account statements and tax documents for more insight into your historical cost basis.
Robinhood doesn’t provide tax advice. For specific questions, consult a tax professional.
Previous average cost calculation
If you’re using an earlier app version for stocks, ETFs, and options trading, Robinhood defines Average Cost as the weighted average amount paid for shares (buys). For crypto, it’s the weighted average amount paid for crypto (buys).
This is the calculation we use for all trades in crypto and retirement accounts today, regardless of which app version you’re using.
This version of average cost is calculated based on buy orders only. It doesn't change based on sell orders or the price of purchases transferred in through the ACATS.
Examples of multiple purchases
When calculating your average cost, you must include all purchases made while holding an asset. This calculation resets when you close out of a position in its entirety (zero shares).
| Activity date | Activity | Quantity | Price | Total amount | Average cost | Explanation |
| Dec. 20 | Buy | 2 | $325 | -$650 | $325 | 2 shares at $325 |
| Jan. 10 | Buy | 2 | $330 | -$660 | $327.50 | 2 shares at $325 and 2 shares at $330 |
| Jan. 15 | Buy fractional | 0.55 | $320 | -$176 | $326.59 | 2 shares at $325, 2 shares at $330, and 0.55 shares at $320 |
| Jan. 15 | Buy fractional | 0.65 | $325 | -$211.25 | $326.39 | 2 shares at $325, 2 shares at $330, 0.55 share at $320, and 0.65 share at $325 |
Example of multiple trades
Buying and selling options contracts outright has no impact on the average cost of corresponding open stock positions. However, the premiums will be included in average cost calculations of the resulting stock following option assignments or exercises. When one or more contracts go through an expiration event, the resulting purchase of shares and their purchase price (strike price of the option), as well as the original option premium, are added to the weighted average calculation.
For example, if a long call is exercised, or a short put is assigned (both result in buying shares), the number of contracts is multiplied by 100 shares, which is then multiplied by the strike price, and added to the cost of the original option. That’s all included in the average price calculation of the corresponding stock.
The cost or proceeds of an option are always factored into the cost basis of the resulting shares. For example, if long calls are exercised, the cost basis of the resulting long shares is determined by adding the premium paid to the options’ strike price (see: long call breakeven option price) and multiplying by 100. Alternatively, assignment after selling a put also results in a long stock position determined by taking the strike price of the call option, subtracting the premium collected (also recreating the short put break even price), and multiplying by 100.
| Activity date | Activity | Quantity | Price | Total amount | Previous average cost | Explanation | New average cost | Explanation |
| Dec. 8 | Buy | 2 | $700 | -$1,400 | $700 | 2 shares at $700 | $700 | 2 shares at $700 |
| Dec. 9 | Buy | 2 | $300 | -$600 | $500 | 2 shares at $700 and 2 at $300 | $500 | 2 shares at $700 and 2 at $300 |
| Dec. 12 | Sell | -2 | -$796 | $1,592 | $500 | 2 shares at $500 with no change to average cost | $300 | 2 shares at $300 (2 shares at $700 are closed through FIFO) |
| Dec. 14 | Buy | 2 | $700 | -$1,400 | $600 | 2 shares at $500 and 2 shares at $700 | $500 | 2 shares at $300 and 2 shares at $700 |
| Dec. 16 | Buy | 2 | $800 | -$1,600 | $666.67 | 2 shares at $500, 2 shares at $700 and 2 shares at $800 | $600 | 2 shares at $300, 2 shares at $700, and 2 shares at $800 |
Example of trading options
Buying and selling contracts outright has no impact on the average cost of corresponding open stock positions. The premiums aren’t included in average cost calculations for option expiration events (assignments or exercises). When one or more contracts go through an expiration event, the resulting purchase of shares and their purchase price (strike price of the option) are added to the weighted average purchase price. The resulting sale of shares reduces the current quantity of the position.
For example, if a long call is exercised, or a short put is assigned (results in buying shares), the number of contracts is multiplied by 100 shares, which is then multiplied by the strike price that’s included in the average price calculation.
| Activity date | Activity | Quantity | Price | Total amount | Previous average cost | Explanation | New average cost | Explanation |
| Jan. 11 | Buy | 2 | $700 | -$1,400 | $700 | 2 shares at $700 | $700 | 2 shares at $700 |
| Jan. 11 | Buy | 2 | $300 | -$600 | $500 | 2 shares at $700 and 2 shares at $300 | $500 | 2 shares at $700 and 2 shares at $300 |
| Jan. 11 | Sell | -2 | -$796.45 | $1,592.90 | $500 | 2 shares at $500 with no change to average cost | $300 | 2 shares at $300 (2 shares at $700 are closed through FIFO) |
| Jan. 11 | Buy | 2 | $700 | -$1,400 | $600 | 2 shares at $500 and 2 shares at $700 | $500 | 2 shares at $300 and 2 shares at $700 |
| Jan. 11 | Buy | 2 | $800 | -$1,600 | $666.67 | 2 shares at $500, 2 shares at $700, and 2 shares at $800 | $600 | 2 shares at $300, 2 shares at $700, and 2 shares at $800 |
| Jan. 12 | Buy | 2 | $100 Call | -$1,000 | $666.67 | No change | $600 | No change |
| Jan. 12 | Exercise | 1 | $100 Call | - | - | - | - | - |
| Jan. 12 | Buy | 100 | $100 | -$10,000 | $132.08 | 2 shares at $500, 2 shares at $700, 2 shares at $800, and 100 shares at $100 | $133.02 | 2 shares at $300, 2 shares at $700, 2 shares at $800, and 100 shares at $105 (includes cost of the exercised option) |