Using charts
Charts are an efficient way to look at a lot of information about a stock, ETF, crypto, or futures price all at once. By showing how much the price has moved up or down in a certain time period, a chart helps you, as an investor, better understand how the price is moving.
Check out Charts in Robinhood Legend for information on how to use charts in Legend.
Overall portfolio return
On your Robinhood account Investing page, your portfolio chart shows today’s overall portfolio return in US dollars and percent. This is based on all your Robinhood account holdings, which is calculated differently depending on if you own crypto or not:
- If no crypto, the daily return is calculated using the previous day’s market closing prices (4 PM ET) as the baseline.
- If you own crypto, the daily return for crypto is calculated using today’s prices as of 12 AM (midnight in your time zone), and for securities is calculated using the previous day’s market closing (4 PM ET) prices as the baselines. The baseline times are different because you can trade crypto 24 hours a day.
For details, review the Overall Portfolio Return section in Robinhood Web Disclosures.
Chart options
On Robinhood, you can view a standard or advanced chart for a stock, ETF, crypto, or futures. There are 2 types of charts you can look at:
- The line chart shows you the closing price at any point in time.
- The candlestick chart shows you 5 data points (open, close, low, high, and price direction) during a time interval, which is significantly more data to view at the same time in one place when compared to the line chart.
In the app, you can view a standard or an advanced version of either the line or candlestick chart. However, on the web, you can only view the candlestick option as an advanced chart.
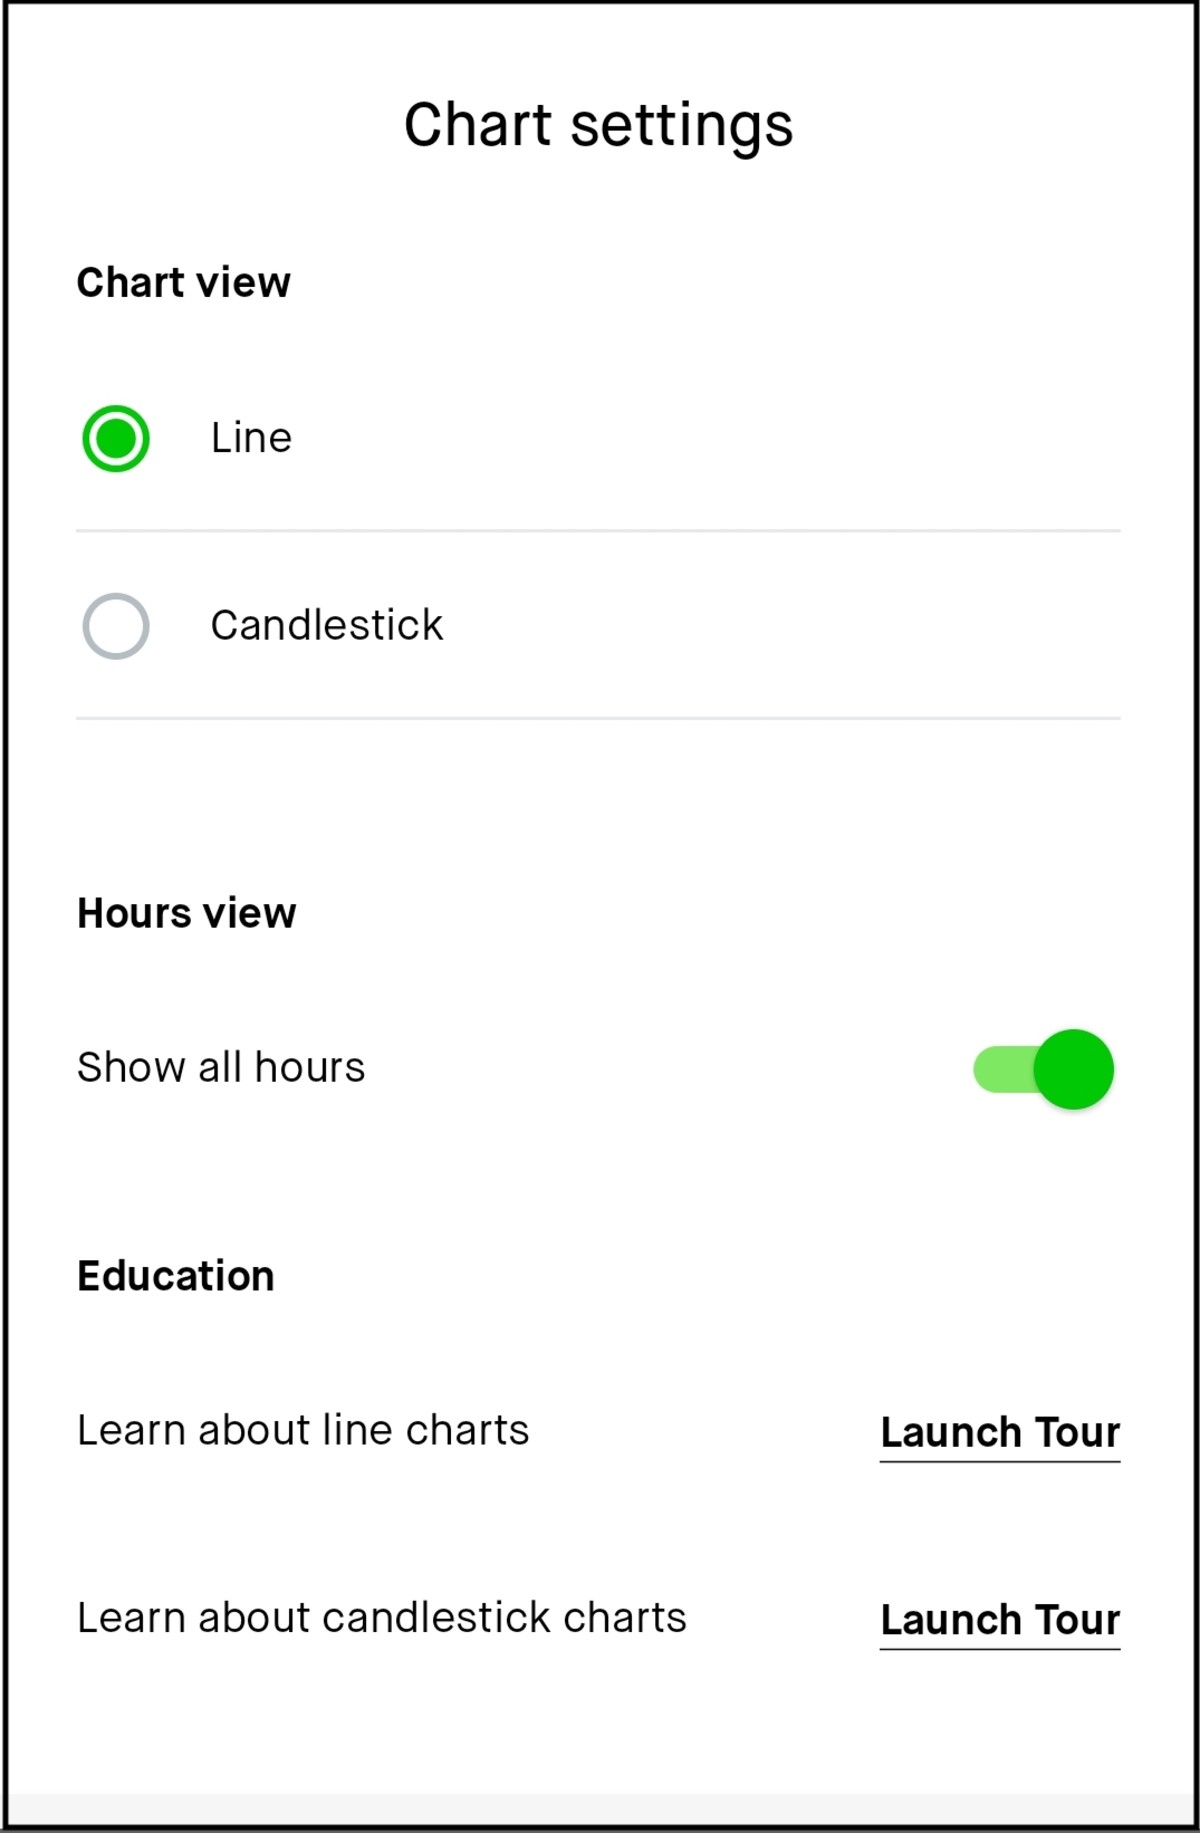
Within a stock’s chart, go to Chart settings (gear icon), where you can:
- In Chart view, change the view type to either Line or Candlestick
- In Hours view, switch Show all hours to the On or Off position
- In Education, select Launch Tour to learn more about line and candlestick charts
Within a stock’s standard line chart view, you can select Launch Tour to learn more about them.
Within a stock’s chart, you can also select Advanced, and then:
- To switch the chart type, select the Chart icon, and then select Line or Candlesticks
- To switch the hours displayed, select Settings (gear icon), and then switch Show extended hours to the On or Off position
Advanced charts
The following shows the difference between the standard and advanced line charts for ROAR within the app:
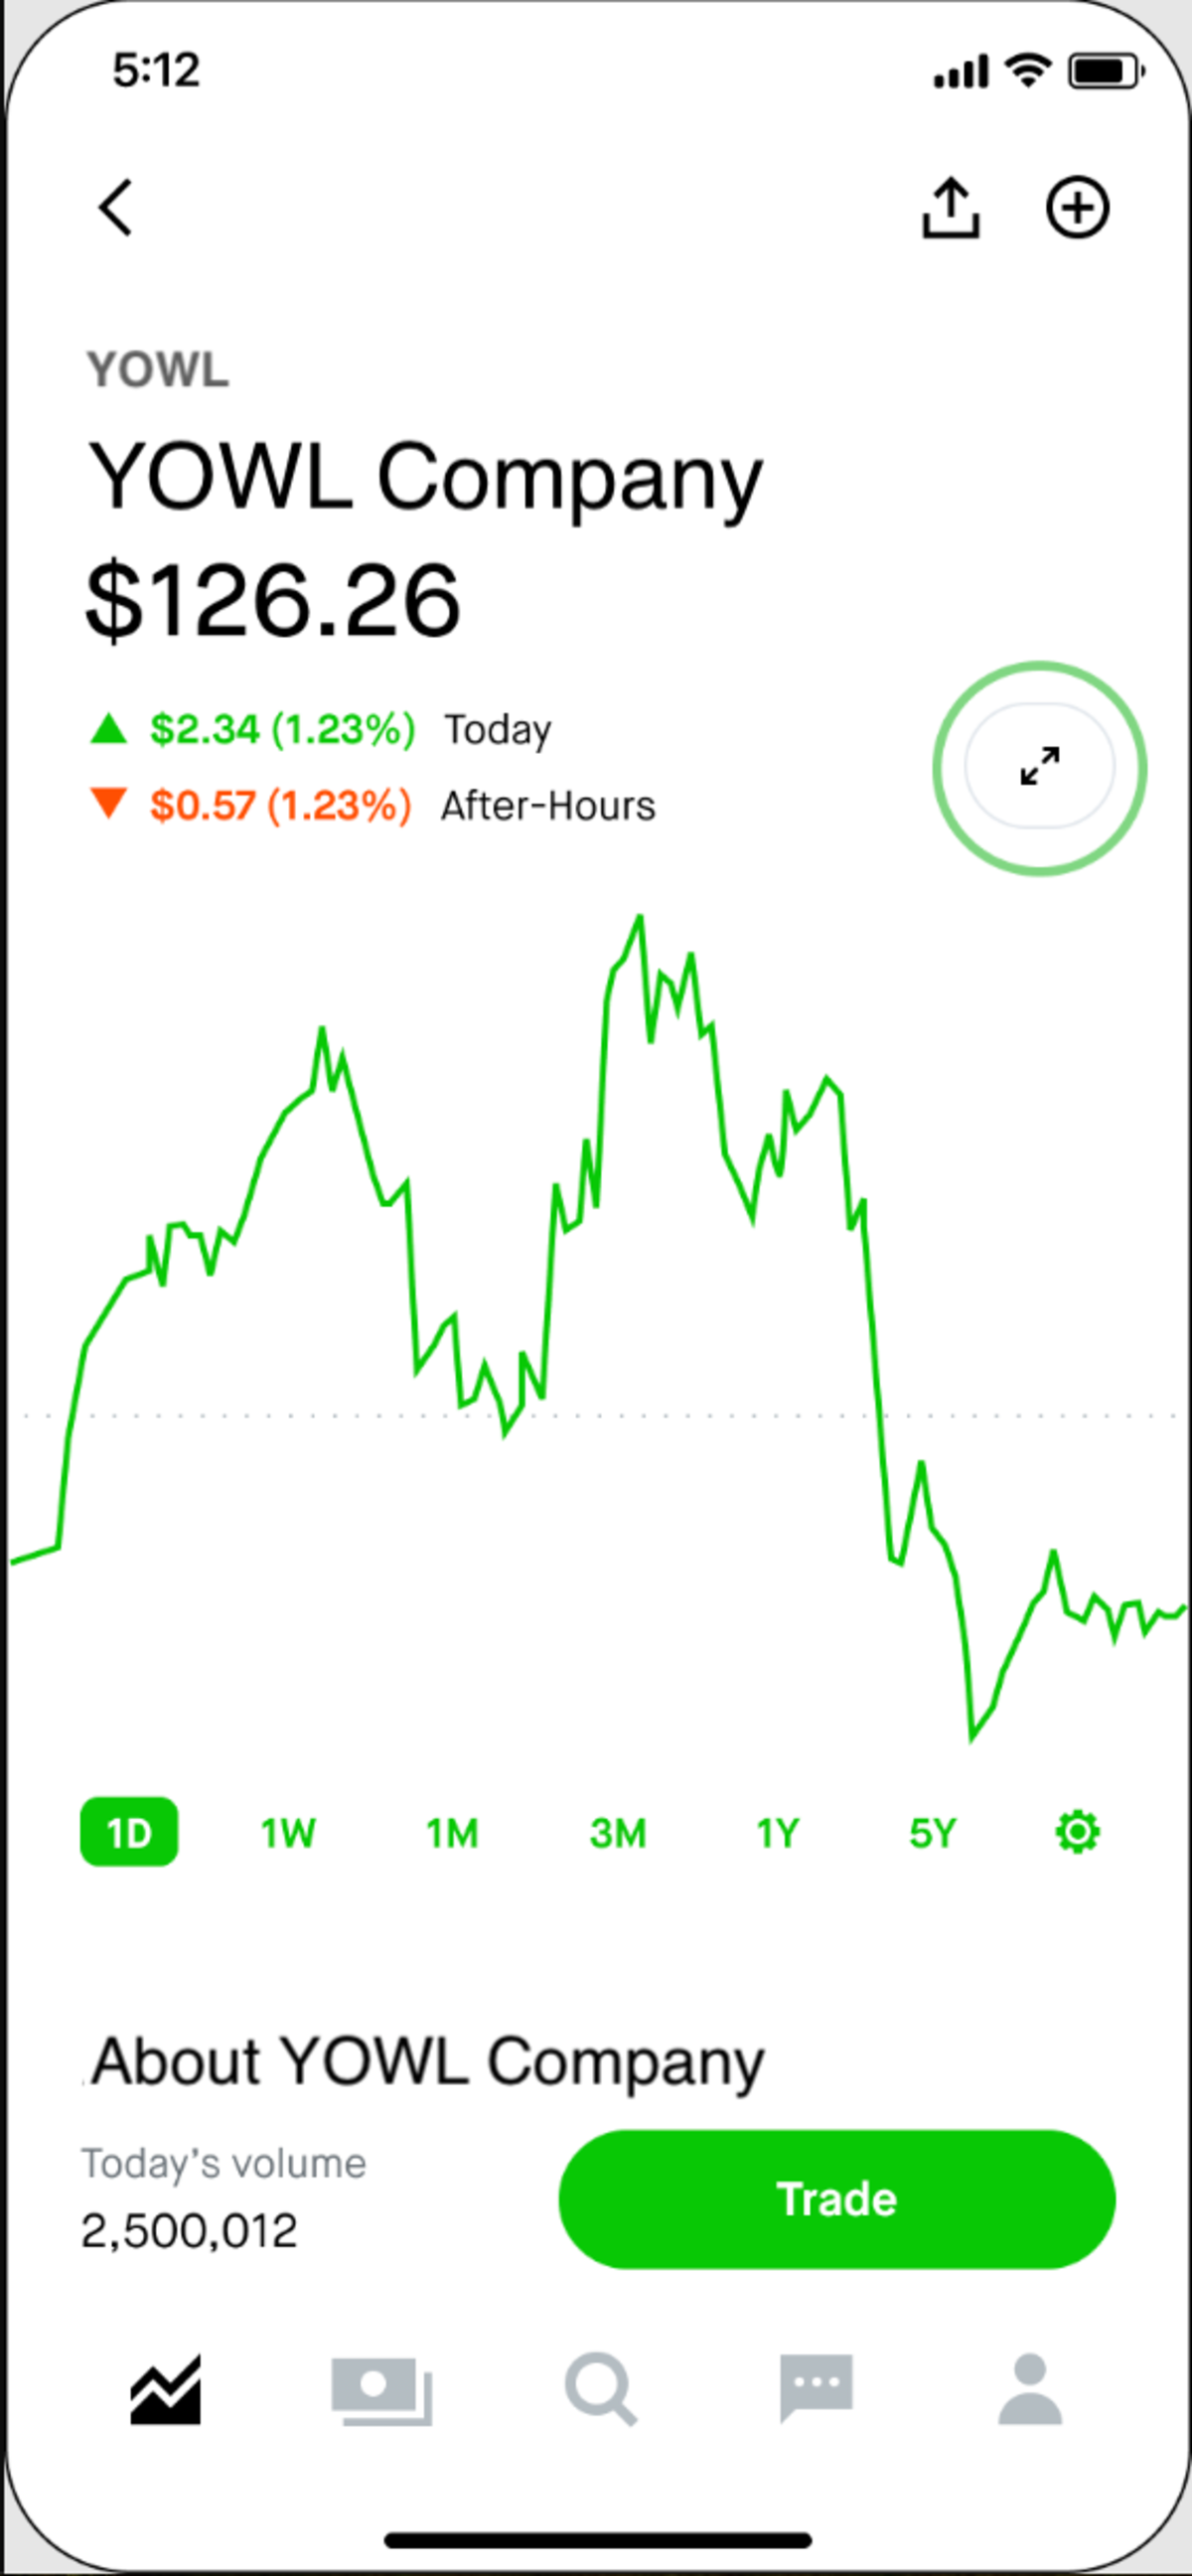
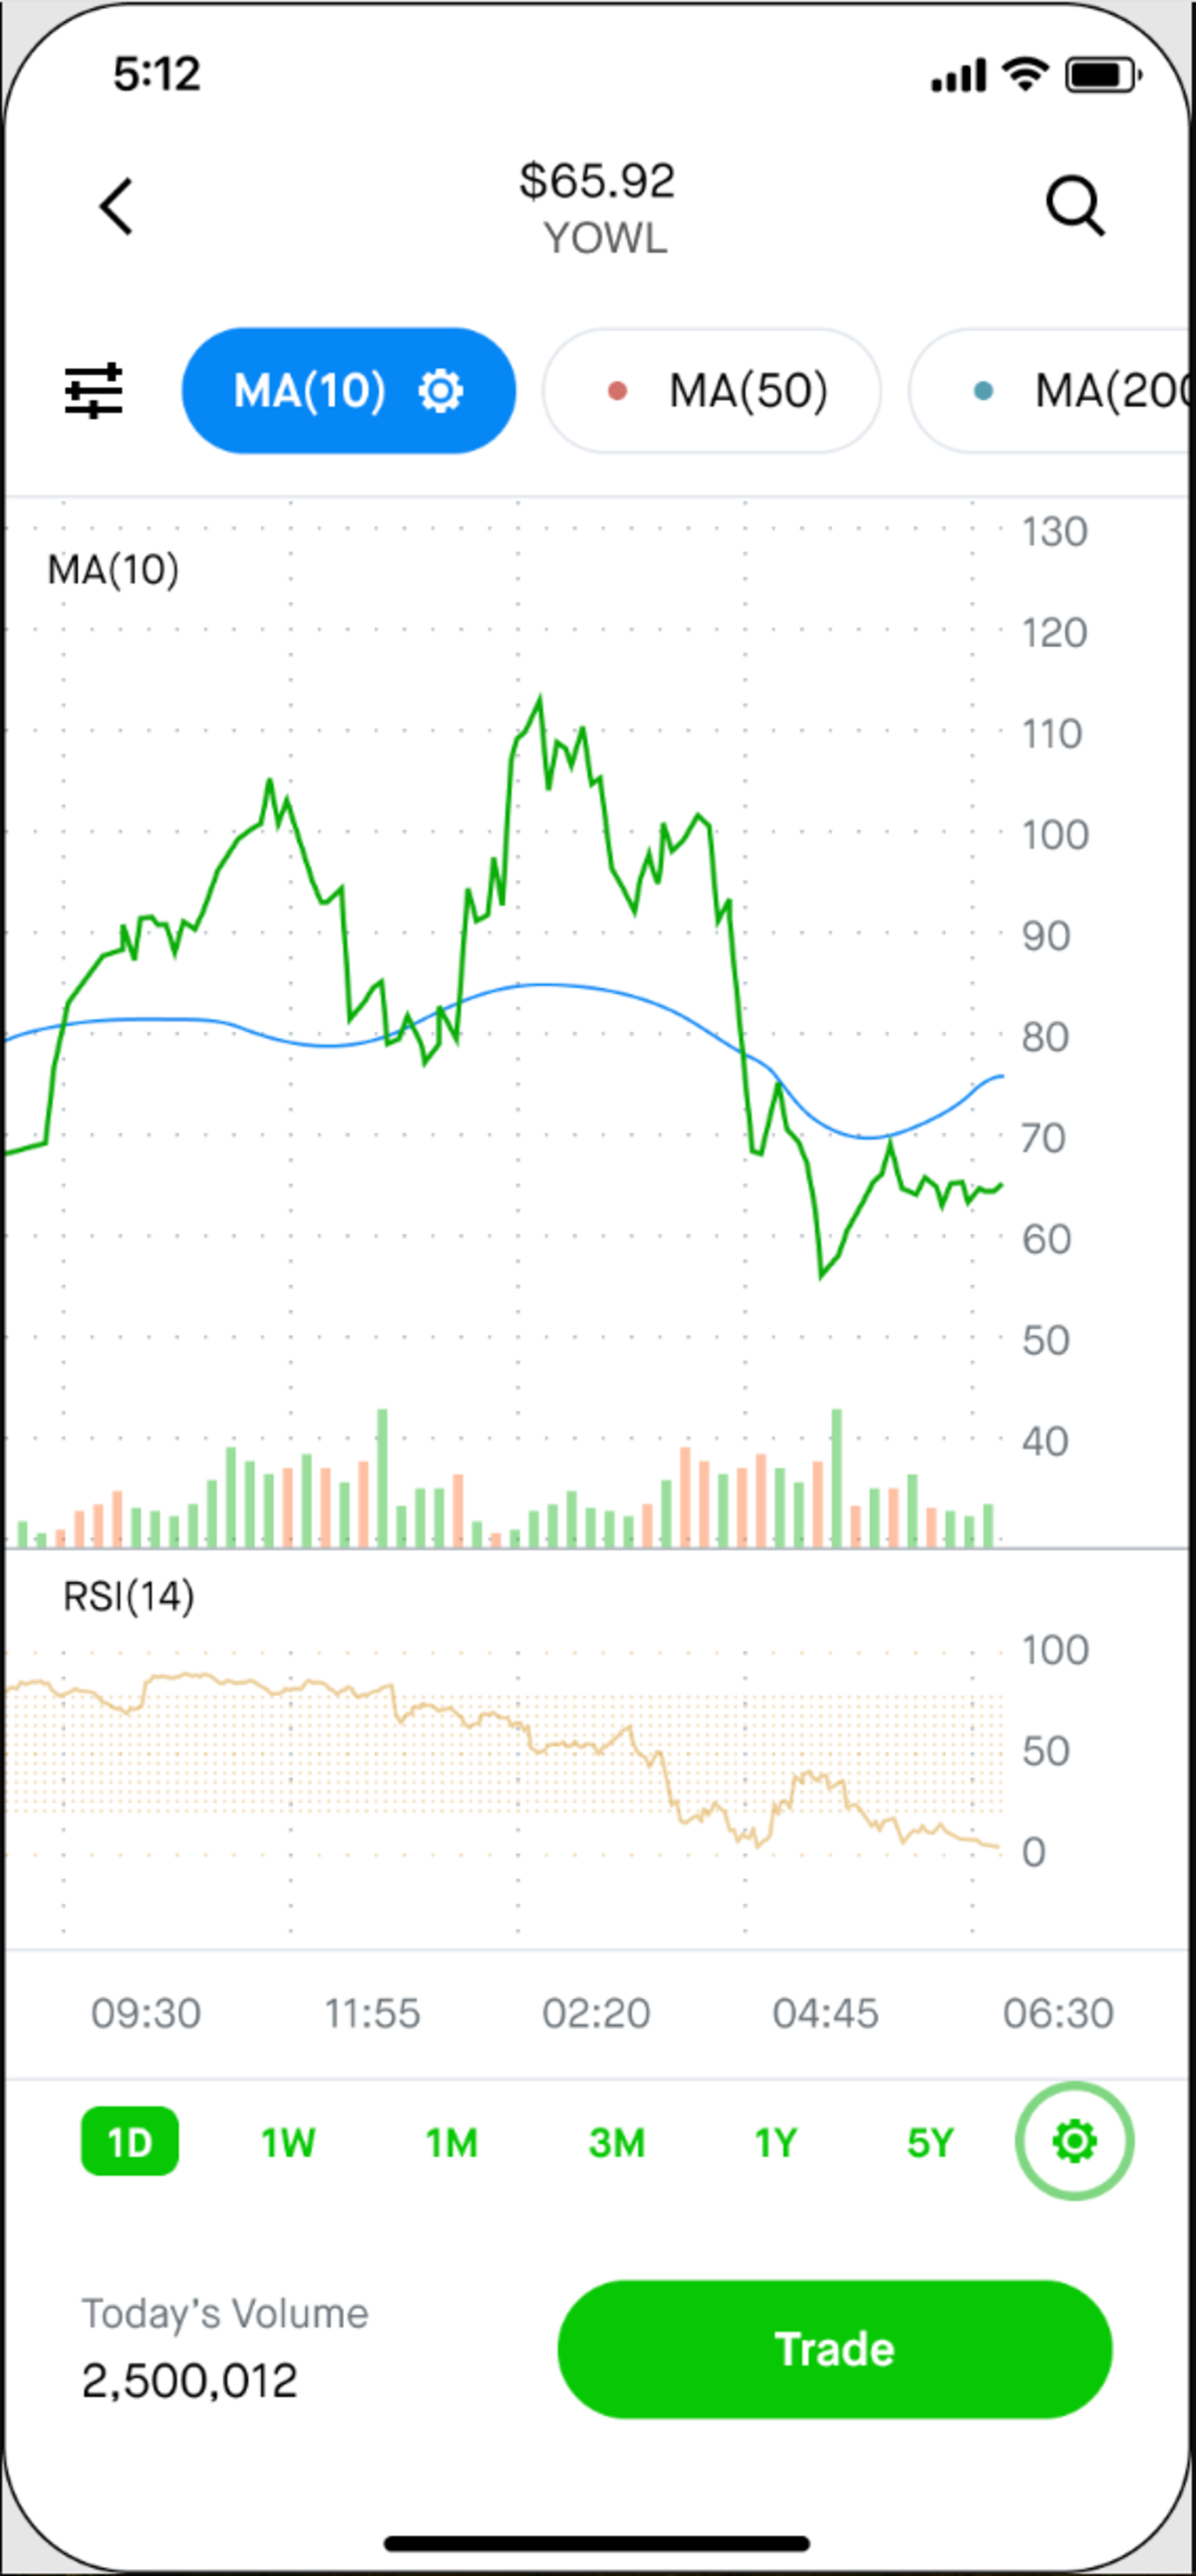
Chart settings
The following shows an example of what’s available when you select View Settings (gear icon) within a chart in the app:
Time intervals
Indicators are calculated over a period of time, which are defined by the number of intervals. The length of an interval depends on the time span shown in the chart. You can select different time spans ranging from 1 day to MAX for stocks and ETFs, and 1 hour to 5 years for crypto. Each time span plots a different time interval.
Interval lengths depend on the selected time span, the chart view, and what you’re viewing it for (stock, ETF, crypto, or futures). On advanced charts in the app, you can customize the interval used in the chart.
With the 24-hour charts, the 1-day (1D) and 1-week (1W) charts show price movements during regular market, extended, and overnight hours, from 12 AM-12 AM ET (24 hours), Monday-Friday. For details, check out Robinhood 24 Hour Market.
The following lists the default time intervals for the available time spans for stock, ETF, crypto, and futures charts.
For stocks and ETFs
- 1D (1-day) chart, 1 interval can be 5 or 10 minutes depending on the chart type and if shown in the app or on the web
- 1W (1-week) chart, 1 interval can be 10 or 30 minutes depending on the chart type and if shown in the app or on the web
- 1M (1-month) chart, 1 interval is 1 hour
- 3M (3-month) chart, 1 interval is 1 day
- YTD (year to date) chart, 1 interval can be 1 hour or 1 day depending on the number of months shown in the chart
- 1Y (1-year) chart, 1 interval is 1 day
- 5Y (5-years) chart, 1 interval is 1 week
- MAX (year 2000 or later) chart, 1 interval can be 1 day, 1 week, or 1 month depending on the amount of history shown in the chart
For crypto
- 1H (1-hour) chart is 15 seconds
- 1D (1-day) chart is 10 minutes
- 1W (1-week) is 1 hour for crypto
- 1M (1-month) chart, 1 interval is 1 hour
- 3M (3-month) chart, 1 interval is 1 day
- 1Y (1-year) chart, 1 interval is 1 week
- 5Y (5-years) chart, 1 interval is 1 month
Custom intervals
In the app, you can also customize the time interval you want to view for a specific time span in an advanced chart.
Select the time span you want to change in the chart, and then select your preferred time interval. For example, the following shows how you can change the time intervals for 3M from 1D to 1H:
Technical indicators
To see all available technical indicators, you need to open the Advanced chart view (2-arrow or expand icon). There you can add, remove, and customize indicators. We’ll save your preferences and apply them to the advanced charts for other stocks.
For more details about what’s shown in the advanced view, check out Technical indicators.
About line charts
The line chart view is shown by default in the app and on the web. A line chart shows the direction of the closing price for a stock or ETF as a quick view of the price trend.
You’ll see the price line in either the standard or advanced chart view. It shows how volatile the price was for the selected time period. Large swings up or down indicate a very volatile price. Short or steady changes imply a relatively stable price that’s moving in one direction during the selected time period.
About candlestick charts
Each candlestick includes the following during the selected time interval of each candle:
- Open is the beginning price
- Close is the price of the last trade
- High is the highest price reached
- Low is the lowest price reached
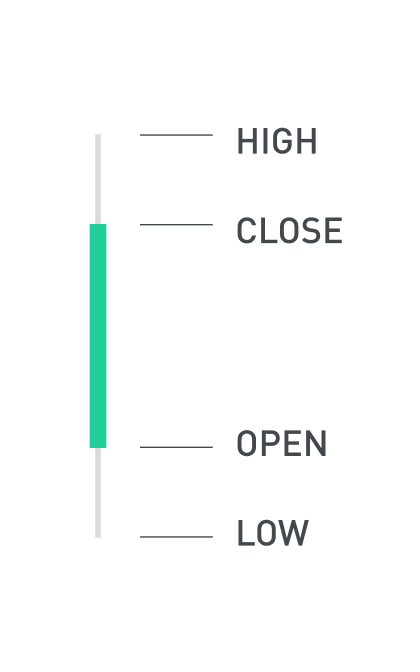
The following shows a candlestick chart, where the body, or thick part, of the candlestick represents the difference in the open and close prices. If it has no body, it means the open and close prices are the same.
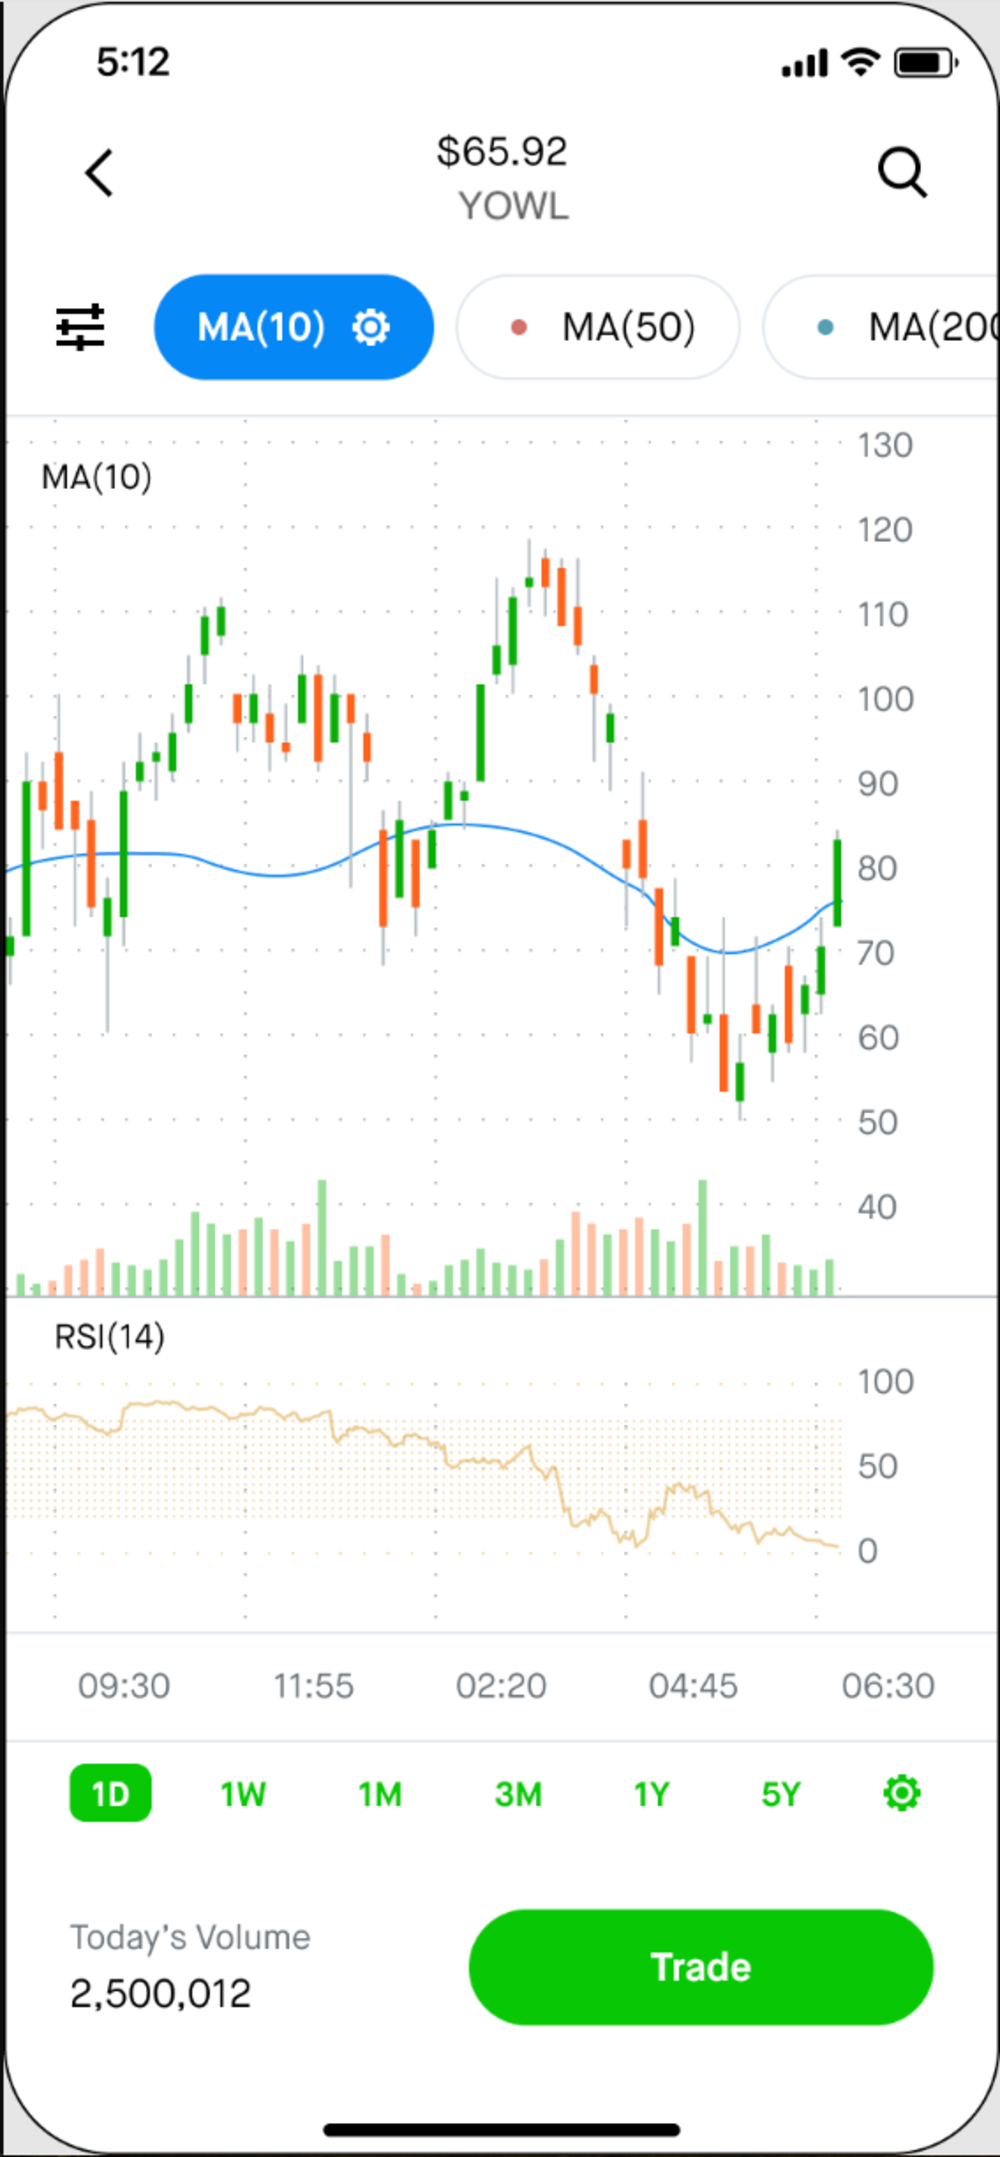
The wicks, or thin lines, of the candlestick represent the high and low prices in the selected time interval.
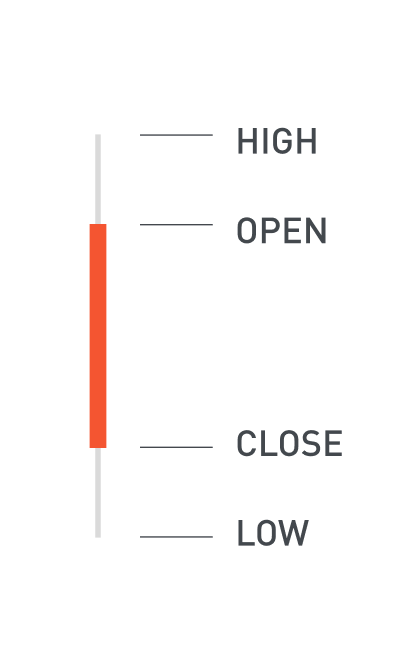
- A bullish candlestick is green when the price has increased, meaning the close price is above the open price:
- A bearish candlestick is red when the price has decreased, meaning the close price is below the open price:
Disclosures
The information contained in advanced charts do not purport to present a complete picture of the financial position, activities, results, actions, or future performance of any index, security, or asset. Any information provided is intended for educational purposes only and should not be considered investment advice or a recommendation of any security or investment strategy. Robinhood does not endorse or adopt any particular investment strategy or approach to evaluating individual securities or assets. While the information is deemed reliable, Robinhood makes no representations or warranties with respect to the accuracy or completeness of the information provided. All investments involve risk, including the possible loss of principal. Investors should consider their investment objectives and risks carefully before investing. Charts, including charts relating to your historic portfolio valuations or performance, or relating to past prices of specific securities, are provided for informational purposes only and should not be relied upon as an accurate or complete presentation of your portfolio value, gains or losses, or the value or financial position of any security. Charts are based on various data sources, which may include market data and other information provided by third party information providers.
Trading outside of regular market hours involves additional risks. For more information, review our Extended-Hours Trading Disclosure.
Robinhood does not make any representation or guarantee relating to the accuracy, timeliness, or completeness of charts or any information or data on which they are based. Without limitation, charts may not accurately take into account the impact of events relating to a specific security, for example corporate actions such as stock splits, dividends, mergers and acquisitions, or events relating to your account or portfolio such as charges, deposits, or withdrawals, and may in certain circumstances overstate or understate gains or losses. In the case of any securities transferred into your Robinhood account from a third-party broker, any performance including charts will be calculated based on their market value as of the date Robinhood receives the securities from the other broker and may be different from the historical performance. Past performance is no guarantee of future results. With respect to your portfolio, refer to your account statements for the relevant period that you receive on a regular basis from Robinhood.